Introduction
Heat exchanger efficiency directly controls energy costs, throughput, and operational reliability. In petrochemical, refining, mining, and manufacturing operations, a 5% efficiency drop compounds into thousands of dollars in wasted fuel, lost production, and emergency maintenance.
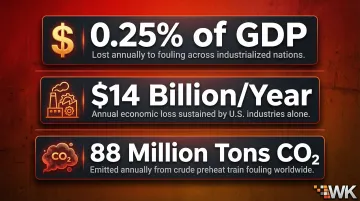
Fouling alone costs industrialized nations approximately 0.25% of GDP annually, with U.S. industries losing an estimated $14 billion per year to heat exchanger fouling and efficiency degradation. In petroleum refining specifically, crude preheat train fouling contributes roughly 88 million tons of CO₂ emissions annually, approximately 2.5% of global human-driven emissions.
When efficiency degrades, operators face a stark choice: accept higher energy bills and reduced throughput, or shut down for unplanned cleaning at enormous cost.
TL;DR
- Heat exchanger efficiency measures actual heat transfer against theoretical maximum—degrading over time from fouling, corrosion, and wear
- Plate heat exchangers often exceed 90% efficiency; shell-and-tube units typically range from 60–80%, depending on design and fouling severity
- Three calculation methods apply: thermal efficiency ratio, LMTD, and NTU-effectiveness
- Advanced coatings that resist fouling and corrosion sustain efficiency and push maintenance intervals further apart
What Is Heat Exchanger Efficiency?
Heat exchanger efficiency is the ratio of actual heat transferred to the maximum theoretically possible heat transfer under given operating conditions. Engineers distinguish this from effectiveness (ε), which compares actual performance against the thermodynamic maximum for a given inlet temperature pair. The reference point is the fluid stream with minimum heat capacity (C_min).
Where efficiency analysis matters:
- Monitoring performance degradation over time
- Benchmarking current operation against design specifications
- Informing cleaning schedules based on trend data
- Evaluating capital equipment replacement decisions
Efficiency benchmarks vary significantly by type:
- Plate heat exchangers frequently exceed 90% efficiency, driven by countercurrent flow and high surface-area-to-volume ratios
- Shell-and-tube exchangers typically operate at lower effectiveness, with performance shaped by pass configuration, baffle spacing, and fouling accumulation
Without proactive maintenance, in-service efficiency declines steadily. Establishing a baseline measurement early makes it possible to catch degradation before it affects output or energy costs.
Key Factors That Affect Heat Exchanger Efficiency
Flow Arrangement
Counter-flow configurations deliver the highest efficiency because they maintain a consistent temperature differential between hot and cold streams along the entire exchanger length. Fluids enter from opposite ends, allowing the cold fluid's outlet temperature to approach—or even exceed—the hot fluid's outlet temperature.
This arrangement maximizes the Log Mean Temperature Difference (LMTD) driving heat transfer.
Parallel (co-current) flow sees the temperature gap shrink rapidly from inlet to outlet, limiting total heat transfer and reducing overall efficiency.
Surface Area and Plate/Tube Design
More plates in plate heat exchangers or larger tube bundles increase heat transfer area, but with diminishing returns. Corrugated or finned surfaces induce turbulence, improving the heat transfer coefficient (h). However, this enhancement carries a trade-off: increasing the chevron angle in plate heat exchangers from 30° to 60° can yield Nusselt numbers 2 to 5 times higher, but friction factors increase 13 to 44 times, dramatically raising pressure drop and pumping costs.
Fouling: The Primary Long-Term Efficiency Killer
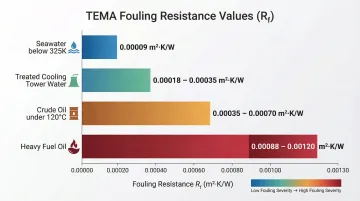
Deposits of scale, biofilm, corrosion products, and particulates act as thermal insulation, increasing thermal resistance and reducing the overall heat transfer coefficient (U). Fouling resistance (R_f) mathematically defines the performance gap: R_f = 1/U_dirty - 1/U_clean.
Typical TEMA fouling resistances:
- Seawater (below 325 K): 0.00009 m²·K/W
- Treated cooling tower water: 0.00018 - 0.00035 m²·K/W
- Crude oil (<120°C): 0.00035 - 0.00070 m²·K/W
- Heavy fuel oil: 0.00088 - 0.00120 m²·K/W
Applying excessively conservative fouling factors increases required surface area, which drops fluid velocity and accelerates particulate settling: the very fouling the oversized design was meant to prevent.
Fluid Properties and Flow Rate
Viscosity, thermal conductivity, and specific heat capacity directly affect the heat transfer coefficient. Higher flow rates increase turbulence (improving the convective coefficient h), but also increase pressure drop. The Dittus-Boelter correlation (Nu = 0.023 Re^0.8 Pr^n) shows that heat transfer scales with Reynolds number to the 0.8 power, while pressure drop scales with velocity squared, requiring careful optimization of both parameters together.
Temperature Differential (LMTD)
Flow rate and fluid selection set physical limits, but inlet conditions determine how much of that potential you actually use. A larger Log Mean Temperature Difference between hot and cold streams drives more heat transfer. Operators can adjust inlet temperatures and flow ratios to recover efficiency before resorting to physical cleaning.
How to Calculate Heat Exchanger Efficiency
Thermal Efficiency Ratio Method
Formula: Efficiency (%) = Q_actual / Q_max × 100
Where:
- Q_actual = ṁ × Cp × ΔT (measured from hot or cold stream's mass flow rate, specific heat, and temperature change)
- Q_max = C_min × (T_hot_in − T_cold_in)
Example: A water-to-water exchanger in a refinery preheat train with:
- Hot stream: 10 kg/s at 150°C inlet, 90°C outlet
- Cold stream: 8 kg/s at 30°C inlet, 80°C outlet
- Cp (water) = 4.18 kJ/kg·K
Q_actual (hot side) = 10 × 4.18 × (150 - 90) = 2,508 kW
C_min = 8 × 4.18 = 33.44 kW/K
Q_max = 33.44 × (150 - 30) = 4,013 kW
Efficiency = (2,508 / 4,013) × 100 = 62.5%
LMTD Method
Formula: LMTD = (ΔT₁ − ΔT₂) / ln(ΔT₁/ΔT₂)
This feeds into: Q = U × A × LMTD
A declining LMTD or rising required area for the same Q signals efficiency loss, typically from fouling. Engineers use this method to verify actual performance against design specifications.
NTU-Effectiveness Method
Formulas:
- NTU = U × A / C_min
- Effectiveness ε = Q_actual / Q_max
Engineers prefer this method when outlet temperatures are unknown and the goal is determining whether a unit will meet process requirements under new conditions. This approach avoids iterative LMTD calculations.
Even with the right method selected, calculation errors can undermine results. These are the most common mistakes engineers encounter:
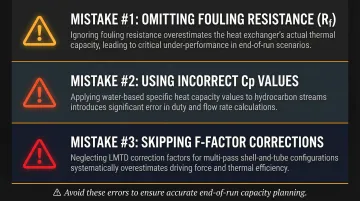
Common Calculation Mistakes
- Omitting fouling resistance (R_f) from the overall U calculation — this overestimates end-of-run capacity
- Applying standard water Cp values to hydrocarbons, which have temperature-dependent properties that shift significantly across operating ranges
- Skipping F-factor corrections for multi-pass or cross-flow configurations — operating in the steep fall-off region produces thermodynamically inoperable designs
How to Improve Heat Exchanger Efficiency: A Step-by-Step Framework
Step 1 – Establish a Baseline
Before any intervention, accurately measure current efficiency using inlet/outlet temperatures, flow rates, and pressure drops. Compare against original design specifications or commissioning data.
Metrics to track:
- Overall heat transfer coefficient (U)
- Effectiveness (ε)
- Fouling factor (R_f)
Declining U over time is the clearest signal of efficiency degradation. Establish a monitoring routine to capture these values weekly or monthly.
Step 2 – Diagnose the Root Cause
Identify whether efficiency loss stems from:
- Fouling (most common): Raises R_f, reduces U uniformly across the exchanger
- Corrosion damage: Creates localized hot spots or cold spots, may cause leaks
- Changes in fluid composition or flow rates: Alters heat capacity rates and Reynolds numbers
- Mechanical issues: Tube leaks reduce effective surface area; bypassing (flow short-circuiting) shows up as reduced effectiveness without proportional U decline
- Operational deviations: Off-spec inlet temperatures or flow imbalances
Each cause presents differently in the data. Fouling shows gradual U decline; bypassing shows sudden effectiveness drop with stable U.
Step 3 – Optimize Operating Conditions
Operational adjustments often recover meaningful efficiency without requiring downtime or physical disassembly:
- Increase velocity: Higher flow rates can dislodge soft fouling deposits and improve turbulence
- Adjust inlet temperatures: Restore the temperature differential driving heat transfer
- Balance flow rates: Ensure C_hot and C_cold are optimized for the specific exchanger geometry
These operational adjustments can recover 5-15% efficiency without downtime.
Step 4 – Clean and Restore the Surface
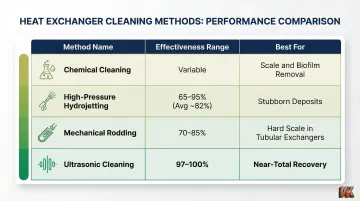
Choose the appropriate cleaning method based on fouling type:
| Method | Effectiveness | Best For |
|---|---|---|
| Chemical cleaning | Variable | Scale, biofilm; can clean shell and tube sides concurrently |
| High-pressure hydrojetting | 65-95% (avg ~82%) | Stubborn deposits; requires bundle extraction |
| Mechanical rodding | 70-85% | Tubular exchangers with hard scale |
| Ultrasonic cleaning | 97-100% | Near-total recovery; cannot be used on aluminum-finned exchangers |
Cleaning frequency should be determined proactively using trend data from overall U tracking—not reactively after a process upset. Incomplete cleaning that returns a unit to 85% cleanliness carries massive hidden costs in lost heat recovery over the subsequent operating cycle.
Step 5 – Protect and Prevent Future Efficiency Loss
After cleaning or refurbishment, implement protective measures to extend the interval between efficiency-degrading events:
- Antifouling chemical dosing: Continuous or periodic injection of scale inhibitors, biocides, or dispersants tailored to your process fluid
- Surface coatings: Diffusion coatings (boronizing, aluminizing) bond metallurgically to tube and shell surfaces, reducing fouling adhesion and corrosion attack without adding meaningful wall thickness
- Material upgrades: Switching to higher-alloy tubes or coated components in high-fouling zones extends time between cleaning cycles
- Flow redesign: Correcting maldistribution—such as adding distributor baffles—eliminates stagnant zones where fouling accelerates
- Condition monitoring: Continuous U tracking with automated alerts enables timely intervention before efficiency losses compound
For heat exchanger components facing severe fouling or high-temperature corrosion, VaporKote's thermal diffusion coatings create an intermetallic surface layer that outperforms standard protective treatments, reducing both fouling adhesion and long-term corrosion damage.
How VaporKote Helps Preserve Heat Exchanger Efficiency
VaporKote serves as a long-term efficiency preservation partner for heat exchanger manufacturers and operators through specialized diffusion coating technologies. Their boronizing and aluminizing processes—chemical vapor deposition methods—form intermetallic compounds at the base metal surface, creating protective layers that directly address the two root causes of efficiency degradation: corrosion and surface wear.
The Efficiency-Preservation Mechanism
By making heat transfer surfaces resistant to corrosion, scale adhesion, and erosive wear, VaporKoted components maintain a lower fouling resistance (R_f) over time. This sustains the overall heat transfer coefficient (U) and reduces the frequency of cleaning shutdowns.
Boronizing creates iron boride phases (FeB and Fe₂B) with hardness values of 14 to 22 GPa (approximately 1400 to 2200 HV)—harder than tungsten carbide cutting tools. This extreme hardness provides exceptional resistance to erosion and particulate wear that would otherwise roughen heat transfer surfaces and accelerate fouling.
Aluminizing diffuses aluminum into steel surfaces, forming intermetallic compounds that oxidize to create a thin, chemically inert alumina (α-Al₂O₃) skin. Studies simulating harsh refinery conditions demonstrate that aluminized coatings resist high-temperature molten salt corrosive attacks without delamination or micro-cracking, maintaining structural integrity where bare carbon and 316 stainless steels fail.
VaporKote specifically offers **aluminized heat exchanger tubing** designed for optimal protection against high-temperature corrosion, extending operational life in thermal processing systems. VaporKote's furnaces can process components up to 68 inches in diameter, enabling full coverage of large-format heat exchanger assemblies.
Long-Term Operational Benefits
In service, VaporKoted components deliver measurable operational advantages:
- Extended service intervals that push planned maintenance windows further apart
- Lower cleaning frequency due to reduced fouling adhesion
- Sustained thermal efficiency over multi-year operating cycles
- Reduced unplanned downtime from corrosion- and wear-related failures
Facilities that integrate diffusion coatings early in their heat exchanger lifecycle typically see the strongest return—fewer interventions, lower cleaning costs, and equipment that holds thermal performance across full operating cycles rather than degrading between shutdowns.
For a consultation on how diffusion coatings can extend your heat exchanger service intervals, contact VaporKote at sales@vaporkote.com or 714-632-8607.
Frequently Asked Questions
What is the efficiency of a standard heat exchanger?
Efficiency varies by type and design. Plate heat exchangers frequently exceed 90% efficiency due to countercurrent flow and high surface-area-to-volume ratios, while shell-and-tube exchangers typically range lower depending on pass configuration and fouling conditions. Both degrade without regular maintenance.
How do you calculate the efficiency of a heat exchanger?
Two main approaches apply: the thermal efficiency ratio (Q_actual / Q_max × 100%) using inlet/outlet temperatures and flow rates, and the NTU-effectiveness method (ε = Q_actual / Q_max) preferred when outlet temperatures are unknown. LMTD verifies performance against design specs.
What is the difference between heat exchanger efficiency and effectiveness?
Efficiency compares actual heat transfer to a practical maximum given operating conditions, while effectiveness (ε) compares actual performance to the thermodynamic maximum possible for the given inlet temperatures—using the fluid stream with minimum heat capacity (C_min) as the reference. Engineers select the appropriate metric based on what's known at the design or operational stage.
What causes heat exchanger efficiency to decrease over time?
Fouling is the primary cause—scale, biofilm, corrosion products, and particulate deposits increase thermal resistance and reduce the overall heat transfer coefficient (U). Secondary factors include surface corrosion or erosion, flow maldistribution, and mechanical failures such as tube leaks or gasket degradation.
How does flow arrangement affect heat exchanger efficiency?
Counter-flow arrangement achieves the highest efficiency by maintaining a consistent temperature differential between hot and cold streams along the full exchanger length, maximizing LMTD. In parallel (co-current) flow, that temperature gap shrinks rapidly from inlet to outlet, limiting total heat transfer.
How can protective coatings improve heat exchanger efficiency over time?
Protective diffusion coatings—such as boronizing and aluminizing—reduce corrosion and fouling adhesion on heat transfer surfaces, maintaining a lower fouling resistance (R_f) and sustaining the overall heat transfer coefficient (U) over longer operational periods. This reduces cleaning frequency and unplanned downtime, extending service life of heat exchanger components.