For industries like oil and gas, petrochemical refining, mining, and heat exchanger manufacturing, this failure mode translates directly into unplanned shutdowns, expensive component replacements, and serious safety exposure. According to AMPP, corrosion costs the oil and gas production sector alone $1.372 billion per year — and erosion corrosion is one of the primary contributors in high-velocity flow environments.
Predicting and preventing it requires understanding all four of its drivers, not just one.
Key Takeaways
- Erosion corrosion combines mechanical film stripping and electrochemical attack in a self-accelerating cycle
- Key risk factors: high fluid velocity, turbulent geometry (bends, elbows), corrosive chemistry, and soft base materials
- Wall thinning from 8.8 mm to under 1 mm in just two years was documented on a natural gas pipeline in a 2023 case study
- Prediction tools include critical velocity analysis, ultrasonic testing, eddy current inspection, and CFD flow modeling
- Effective prevention requires combining design changes, velocity control, material selection, and protective coatings — no single approach works alone
What Is Erosion Corrosion and What Causes It?
Erosion corrosion is the accelerated material loss that results when mechanical erosion and electrochemical corrosion act together. A moving fluid — or fluid carrying solid particles — physically strips away the passive oxide film that protects the metal surface. Bare metal is exposed. Corrosion attacks it.
The corrosion products are then swept away by the next pass of fluid, re-exposing fresh metal. The cycle repeats, and the combined damage rate consistently exceeds what either mechanism would cause alone — sometimes by a factor of ten or more.
Common surface signatures include directional grooves, wave-like scalloping, and pitting aligned with flow direction. You'll find it on pipe inner surfaces downstream of bends, on pump impeller vanes, at heat exchanger tube inlets, and on valve seats.
Fluid Velocity and Turbulence
Every alloy has a critical flow velocity threshold. Below it, a protective film forms and holds. Above it, the fluid shear strips that film faster than it can regenerate. Turbulence at pipe bends, elbows, constrictions, and diameter changes concentrates this mechanical damage in specific zones.
Research on elbow geometry shows that 90-degree carbon steel elbows under slug flow produced 12 times higher mass-loss rates than 30-degree elbows. Increasing bend radius ratio from r/D 1.5 to 5 reduced erosion by 66%. Geometry matters enormously.
Corrosive Fluid Chemistry
Once the protective film is removed, the rate at which bare metal corrodes depends entirely on what's in the fluid. Dissolved oxygen, chlorides, and low pH all accelerate the electrochemical half of the damage cycle. Research confirms that even trace changes in chromium content, solution pH, and oxygen levels measurably shift flow-accelerated corrosion rates.
Cooling water systems, oil refinery process streams, and seawater service face the worst of this combined attack — and the fluid chemistry largely determines which materials can survive those environments.
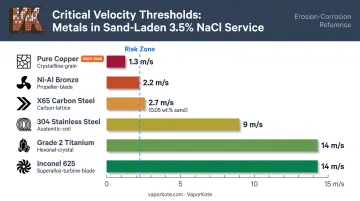
Vulnerable Base Materials
Not all metals are equally exposed. Pure copper reaches its critical velocity in real seawater at just 1.3 m/s. Ni-Al bronze holds to 2.2 m/s. 304 stainless steel, with no solids in 3.5% NaCl, can exceed 20 m/s — but add 2% sand and that drops to 9 m/s. Grade 2 titanium and Inconel 625 both hold to 14 m/s in the same sand-laden condition.
Soft alloys and materials relying on thin passive films fail earliest. Harder alloys with stable passive layers offer notably greater resistance — and in sand-laden or high-velocity service, that difference in threshold velocity often determines whether a component survives its design life.
Mechanical Factors and System Design
Sharp pipe bends, installation burrs, abrupt diameter changes, and partial blockages all create localized impingement zones. Solid particles in the fluid — sand, slurry fines, scale fragments — dramatically amplify mechanical damage. X65 carbon steel's critical velocity dropped from 7.4 m/s to 2.7 m/s when sand concentration increased from 0.005 wt.% to 0.05 wt.%. A tenfold increase in solids content nearly tripled the risk.
The Real Cost of Ignoring Erosion Corrosion
The failure progression follows a predictable sequence: wall thinning → localized pitting → perforation → leakage or catastrophic failure. Because each stage leaves the surface more vulnerable, damage compounds at each stage rather than leveling off.
A 2023 failure investigation of an API X52 natural gas pipeline makes the scale concrete. Carrying gas at 22 m/s through a 95-bar system, the line failed twice after its 2015 startup. Downstream of an elbow outlet, combined sand impingement, turbulent flow from a cross-section change, and FeCO₃ film breakdown reduced wall thickness from 8.8 mm to under 1 mm in two years — roughly 4 mm/year of material loss.
Across high-velocity process environments, that kind of degradation rate carries direct operational costs:
- Petrochemical plants: Unplanned shutdowns triggered by pipe failures in high-velocity process streams
- Oil drilling systems: Downhole tubing and surface piping degradation accelerated by sand-laden production fluids
- Mining operations: Aggressive impeller replacement cycles in slurry pumps handling abrasive solids
- Heat exchanger manufacturing: Tube leaks at inlet ends where fluid velocity and turbulence peak
Warning Signs You're Already Dealing With It
Visual indicators:
- Directional groove patterns or scalloping on internal surfaces
- Unexpected localized thinning near bends, elbows, or fittings
- Roughened or pitted surfaces in high-flow zones
- Discoloration or deposits near turbulent areas
Process performance indicators:
- Unexplained drops in flow efficiency or system pressure
- Increased energy consumption in pump systems
- Elevated dissolved metals in process fluid samples
Predicting Erosion Corrosion: Methods and Indicators
Effective prediction means identifying risk before the damage cycle starts — catching it at the monitoring stage, not the failure stage.
Critical Velocity Analysis
Every material has a velocity threshold specific to its fluid environment and solid loading. Engineers can consult material-specific velocity data and flow modeling outputs to determine whether operating conditions for a given system approach or exceed these thresholds. Velocity thresholds shift with alloy composition, fluid chemistry, and particle content, so generic tables don't apply — material-specific lookup is essential.
NDT Methods for Monitoring
Two methods cover the majority of industrial monitoring needs:
- Ultrasonic Testing (UT): Measures pipe and vessel wall thickness to within 0.1 mm, with trending tools that detect gradual thinning over time. ASNT confirms its use across petrochemical piping and pressure vessels for corrosion and wear monitoring
- Eddy Current Testing (ECT): Applied to heat exchanger tubes to detect corrosion, erosion, cracking, and other tubing changes — especially useful at tube inlets where erosion corrosion concentrates
Both should be applied proactively at known high-risk locations, not just after a failure event.
NDT tells you where damage is occurring. Computational flow modeling helps prevent it from occurring in the first place.
Computational Flow Modeling
CFD simulation identifies turbulent zones, impingement angles, and high-shear areas in a system's geometry before physical damage occurs. Wall shear stress outputs are the key metric — they quantify the mechanical forces stripping protective films at specific locations. Running simulations at the design stage, or during a retrofit evaluation, lets engineers correct geometry-driven risk before it enters service.
Laboratory Test Standards
For evaluating how a specific material will perform before deployment:
- ASTM G76: Solid particle impingement using a jet-nozzle apparatus — applicable for slurry and sand-laden service
- ASTM G73: Liquid impingement using a rotating apparatus at velocities of approximately 60–600 m/s — applicable for high-velocity liquid service
Fluid Chemistry Monitoring
Regular sampling for dissolved oxygen, pH, chloride concentration, and suspended solids content provides an early warning layer. Rising corrosive species concentrations or increased particle loads signal escalating risk — giving engineers a window to act before wall thickness loss begins.
How to Prevent Erosion Corrosion
Prevention works when it addresses all three dimensions simultaneously: mechanical, chemical, and material. A single measure rarely holds in demanding industrial environments.
Streamline Flow Path Design
Geometry is one of the highest-leverage intervention points:
- Replace 90-degree bends with 45-degree or longer-radius alternatives (increasing r/D from 1.5 to 5 reduces erosion by 66%)
- Remove installation burrs that create localized turbulence
- Eliminate abrupt diameter changes
- Use flow deflectors or baffles to redirect impingement away from vulnerable surfaces
This is most cost-effective at the design stage. Retrofit modifications at known failure locations are also practical and cost-effective.
Control Fluid Velocity and Chemistry
Velocity control options:
- Install flow restrictors or use larger-diameter piping to reduce wall shear
- Adjust pump operating parameters to keep velocity below material-specific critical thresholds
Chemical control options:
- Reduce dissolved oxygen through deaeration or oxygen scavengers
- Adjust pH to reduce the electrochemical attack rate on exposed metal
- Apply corrosion inhibitors to limit the chemical half of the damage cycle
- Use cathodic protection for submerged or buried components to minimize corrosion on bare metal
Select Erosion-Corrosion-Resistant Materials
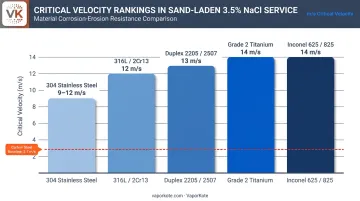
For new installations, material selection at the design stage delivers the longest-lasting protection — no retrofit required. Higher-resistance options include:
| Material | Typical critical velocity (with 2 wt.% sand, 3.5% NaCl) |
|---|---|
| 304 Stainless Steel | 9–12 m/s |
| 316L / 2Cr13 Stainless | 12 m/s |
| Duplex 2205/2507 | 13 m/s |
| Grade 2 Titanium | 14 m/s |
| Inconel 625/825 | 14 m/s |
For existing carbon steel or copper alloy systems operating above their thresholds, material upgrade or surface treatment becomes the practical path forward.
Apply Protective Surface Coatings
For existing components, or where material substitution is cost-prohibitive, advanced surface coatings offer a direct solution. VaporKote's chemical vapor deposition process — covering both boronizing and aluminizing — forms an intermetallic compound at the base metal surface rather than simply depositing a layer on top of it. The result is a metallurgical bond with extreme hardness: 1,500 Knoop (RC75+ equivalency), harder than tungsten carbide cutting tools.
That hardness directly resists the mechanical erosion component of the failure mode. VaporKote applies this process to components in the highest-risk zones: pump impellers, wear rings, valve components, heat exchanger tubing, and high-temperature nozzles.
For petrochemical, oil refining, mining, and heat exchanger applications where replacement costs accumulate quickly, a one-time coating treatment can significantly extend service life and reduce recurring maintenance costs.
VaporKote's furnaces can process components up to 68 inches in diameter, making this approach practical for the oversized parts common in oil drilling and mining operations, not just smaller fittings.
Tips for Long-Term Prevention and Control
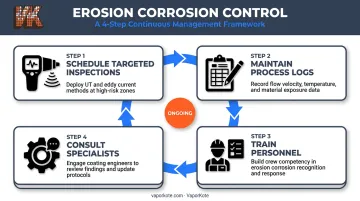
Long-term erosion corrosion control depends on consistent operational habits built into maintenance programs. These four practices form a workable framework:
Schedule targeted inspections — Apply UT or eddy current testing at known high-risk zones (bends, impellers, heat exchanger tube inlets) at regular intervals. Track wall thickness trends over time rather than treating each measurement as isolated data.
Maintain process logs — Document fluid velocity, temperature, pH, dissolved oxygen, and suspended solids content. Deviations from baseline are early intervention triggers, not just records.
Train personnel to identify erosion corrosion specifically — It presents differently from uniform corrosion or general pitting. Directional scalloping and localized thinning near geometry changes are its signatures. Establish clear escalation protocols when these are found.
Consult specialists for design modifications or coating upgrades — Flow modeling and surface treatment expertise can reduce inspection frequency and extend service intervals significantly.
For high-wear applications where standard materials are failing, thermal diffusion coatings — such as boronizing or aluminizing — can be worth evaluating. VaporKote works with petrochemical, mining, oil production, and heat exchanger clients to assess whether a coating solution fits the specific wear and corrosion conditions of a component.
Frequently Asked Questions
What is erosion corrosion?
Erosion corrosion is accelerated material loss caused by the combined action of mechanical erosion (moving fluid or particles stripping protective surface films) and electrochemical corrosion attacking the exposed bare metal. The two processes reinforce each other, producing damage rates far beyond what either mechanism causes on its own.
What are the two main causes of erosion corrosion?
The two primary causes are high-velocity or turbulent fluid flow that mechanically strips protective surface films, and corrosive fluid chemistry (dissolved oxygen, chlorides, or acids) that attacks the bare metal once those films are gone.
What is the difference between erosion and corrosion?
Erosion is purely mechanical: moving fluid or particles physically remove surface material. Corrosion is electrochemical: the metal reacts with its environment and degrades through chemical attack. Erosion corrosion is the damaging combination of both occurring simultaneously at the same surface location.
Which materials are most vulnerable to erosion corrosion?
Soft alloys such as copper, copper-nickel, and lead-based alloys are especially susceptible because their protective films are easily disrupted by flow forces. Materials with stable passive films, including stainless steels, titanium, and nickel-based alloys, show notably higher resistance.
How does fluid velocity affect the rate of erosion corrosion?
Most alloys have a critical velocity threshold above which protective film removal accelerates sharply and corrosion rates climb fast. This threshold varies by alloy, fluid chemistry, and particle content. Adding even small amounts of sand, for example, can cut that threshold by more than half for carbon steels.